How to Create Graphs
Graphs can be generated from the user or admin panels.
This example will show how to generate a graph for the Max Exhaust Temperature for a certain rack over the last week.
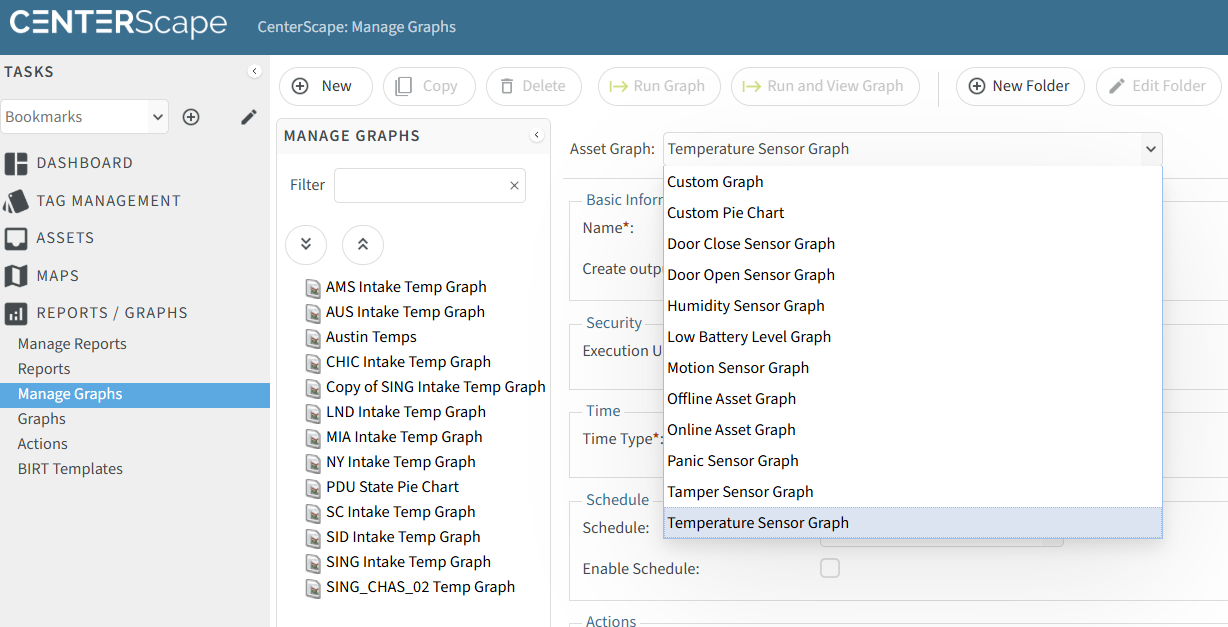
From the user panel, navigate to Manage Graphs and select Temperature Sensor Graph from the Asset Graph dropdown list.
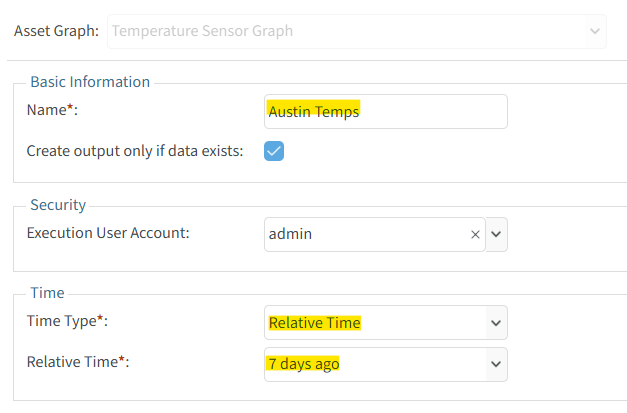
Give the graph a meaningful name.
Make sure the 'Create output only if data exists:' is checked. Leaving this unchecked can be helpful as well, but a blank graph will be generated if no filters match.
For the Time parameters, select Relative Time and make it 7 days ago.
Filter type should be Rack
Select the location desired. In this example it is a specific rack.
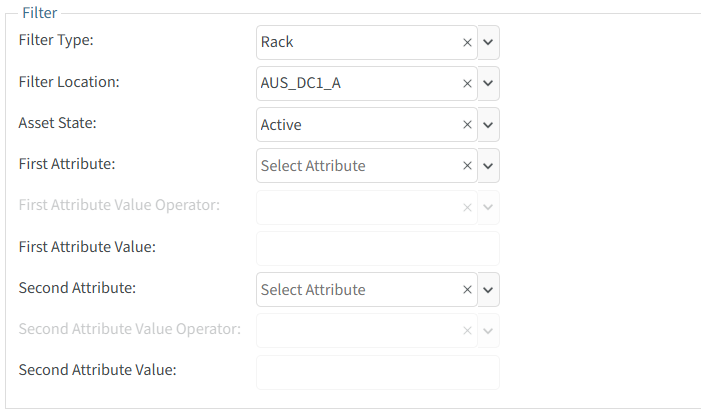
The attribute that should be selected for this graph is Max Exhaust Temperature

Click Save Changes and the graph can be run by clicking on Run Graph or Run and View Graph
How to schedule graphs to be run at a certain time(s)
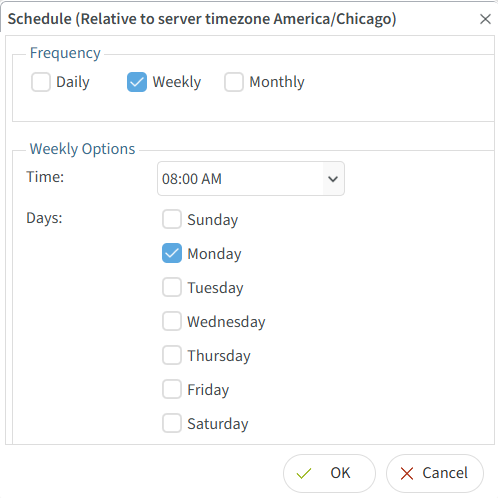
To schedule graphs to be run at certain times, click on the ellipses in the Schedule section and select the desired schedule. This example will run this report every Monday at 8 AM.

How to email graphs to users
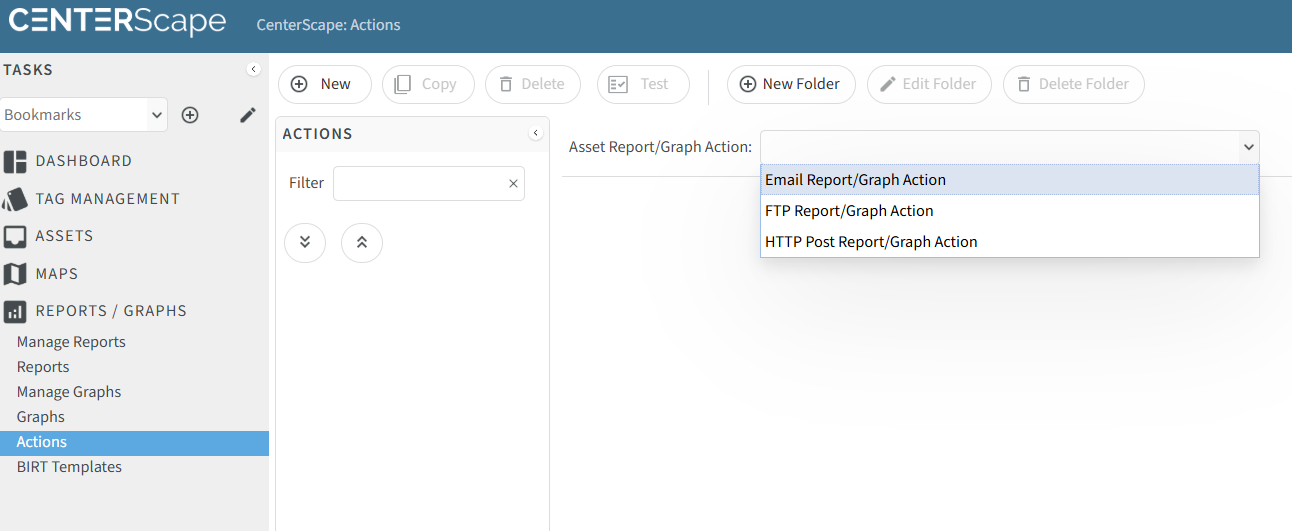
In order to email users, select Email Report/Graph Action from the dropdown in the Actions menu item.
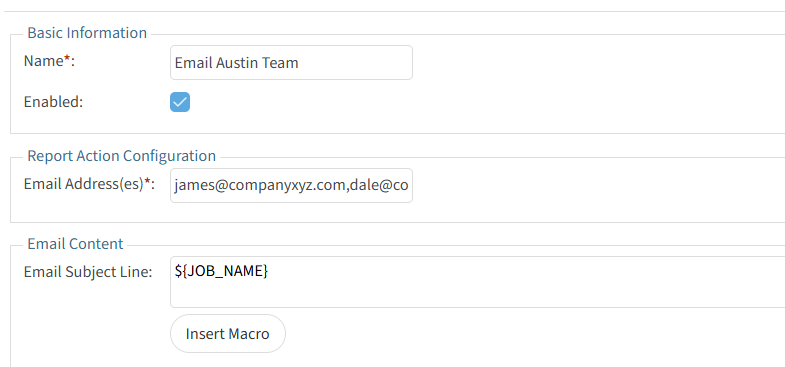
Give the Action a name and enter email address(es) separated by a comma.
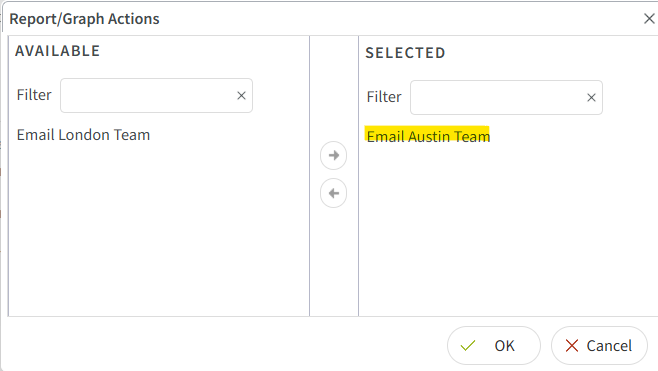
The graph can be edited to include the email action by clicking on the ellipses in the Actions section.

Select the desired email action.
This graph will run automatically according to the schedule every Monday at 8 AM it will be emailed to the selected email actions.